Grafana & Prometheus
Spice can be monitored with Grafana using the Spice Metrics Endpoint and pre-built dashboards available in the Spice repository.
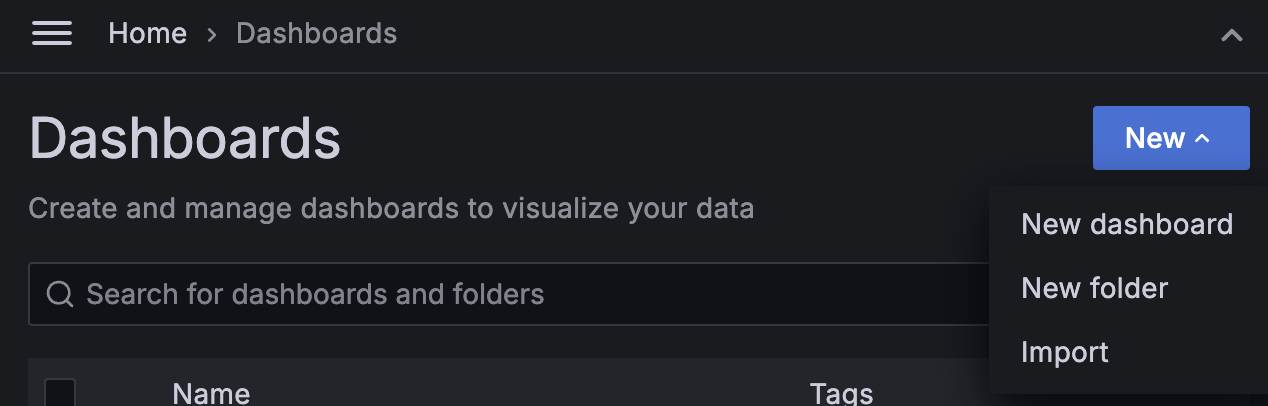
Import Grafana Dashboard
Navigate to the Dashboards section in Grafana and click "New" > "Import".
Copy the dashboard JSON from monitoring/grafana-dashboard.json into the Grafana import box.
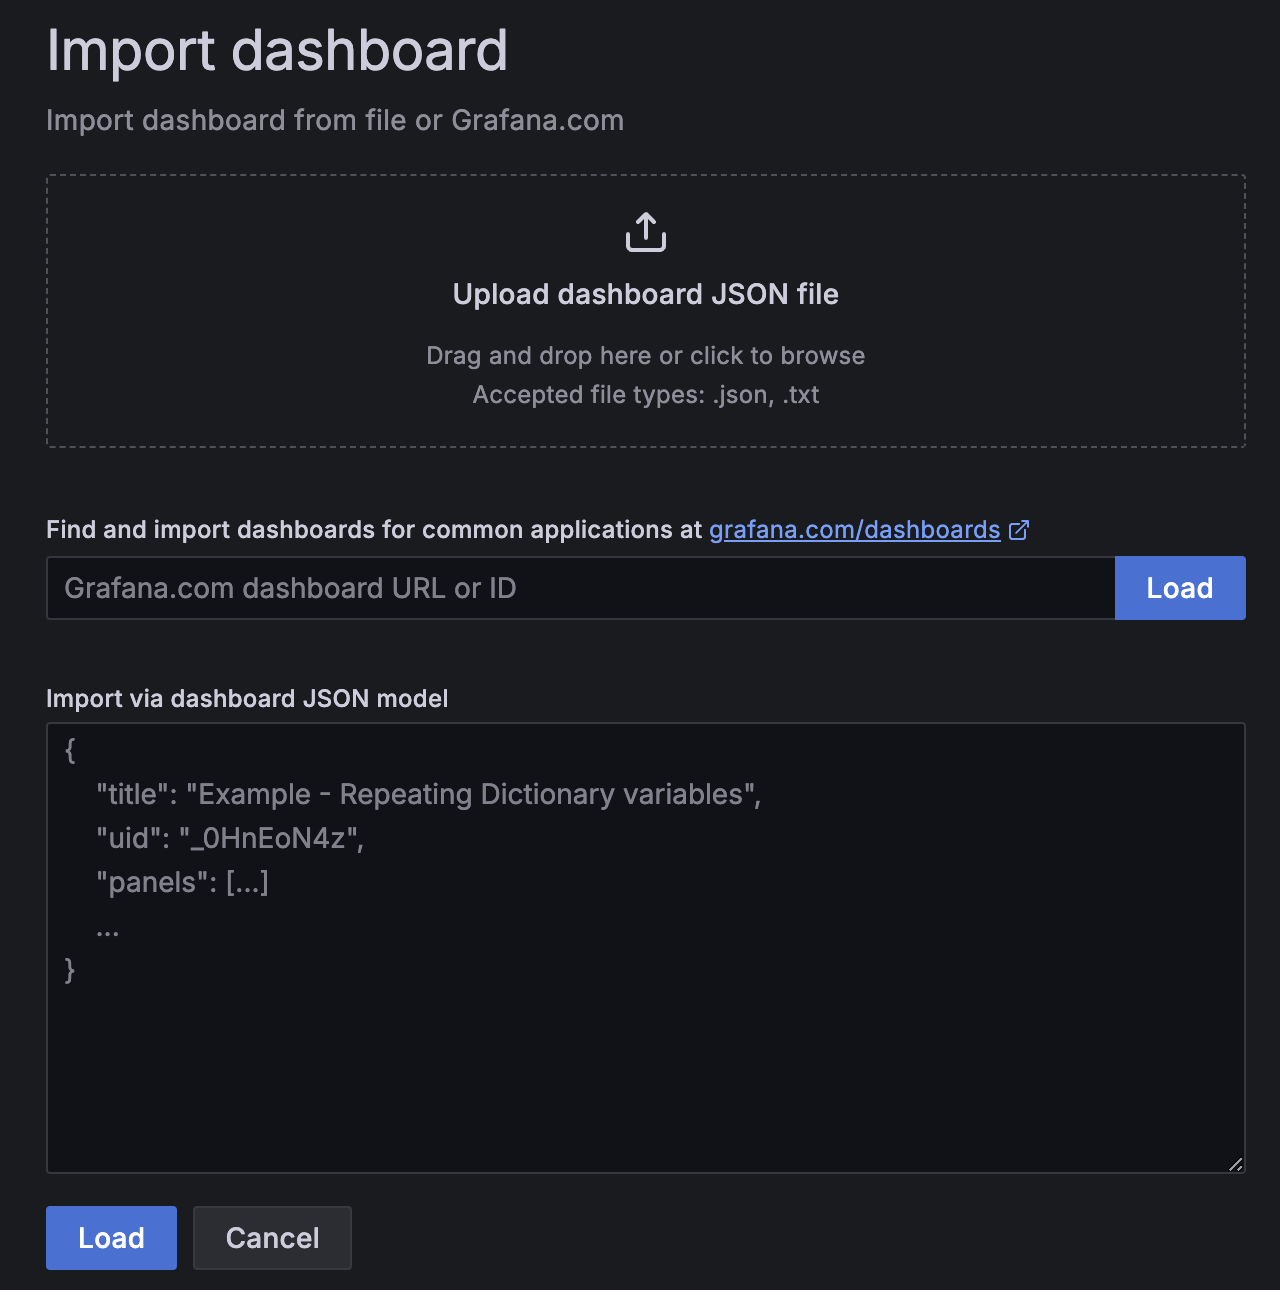
Click "Load".
Kubernetes
View the Kubernetes deployment guide for configuring the Prometheus Operator to scrape metrics from the Spice instances in Kubernetes.
Prometheus
Configure a Prometheus instance to scrape metrics from the Spice runtimes.
global:
    scrape_interval: 1s
    scrape_configs:
    - job_name: spiceai
        static_configs:
        - targets: ['127.0.0.1:9090'] # Change to your Spice runtime endpoint + port
Local Quickstart
This tutorial creates and configures Grafana and Prometheus locally to scrape and display metrics from several Spice instances. It assumes:
- Two Spice runtimes,
spiced-mainandspiced-edge, are running on127.0.0.1:9091and127.0.0.1:9092respectively.
-
Create a
compose.yaml:version: '3'
services:
prometheus:
image: prom/prometheus:latest
volumes:
- ./prometheus.yaml:/etc/prometheus/prometheus.yml
ports:
- 9090:9090
network_mode: 'host'
grafana:
image: grafana/grafana:latest
volumes:
- ./.grafana/provisioning:/etc/grafana/provisioning
ports:
- 3000:3000
network_mode: 'host' -
Create a
prometheus.yamltoglobal:
scrape_interval: 1s
scrape_configs:
- job_name: spiced-main
static_configs:
- targets: ['127.0.0.1:9091']
- job_name: spiced-edge
static_configs:
- targets: ['127.0.0.1:9092'] -
Add a prometheus as a source to grafana. Create a
.grafana/provisioning/datasources/prometheus.ymlapiVersion: 1
datasources:
- name: Prometheus
type: prometheus
access: proxy
url: http://localhost:9090
isDefault: true -
Run the Docker Compose
docker-compose up -
Go to
http://localhost:3000/dashboard/importand add the JSON from monitoring/grafana-dashboard.json. -
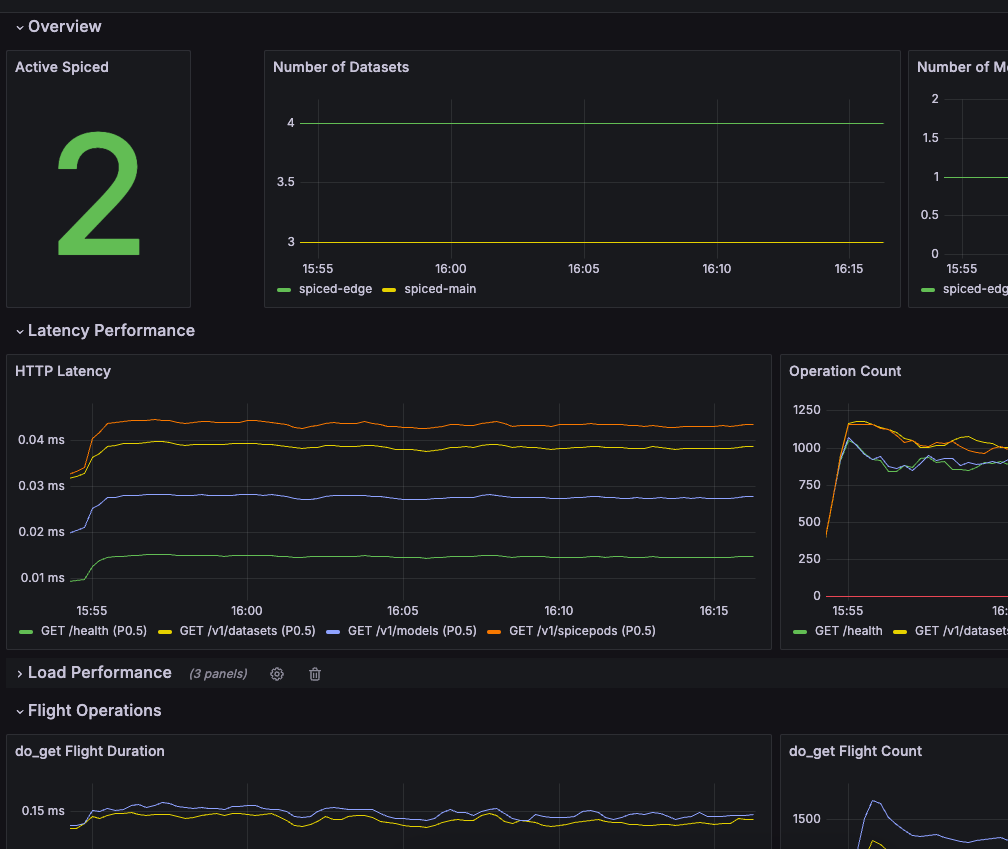
The dashboard will have data from the Spice runtimes.
Query Spice as a Grafana Data Source
In addition to monitoring Spice with Grafana, you can query datasets served by Spice and visualize the results in Grafana panels using the Infinity data source, which can query Spice's HTTP SQL API.
-
Install the Infinity data source plugin from the Grafana plugin catalog.
-
Add a new Infinity data source. No base URL or authentication is required at the data source level when targeting a Spice runtime that does not require an API key — credentials can be configured per query if needed (see API Auth).
-
Create a panel backed by the Infinity data source and configure the query as an HTTP request against the Spice SQL endpoint:
-
Type:
JSON -
Method:
POST -
URL:
http://localhost:8090/v1/sql -
Headers:
Content-Type: application/json -
Body (raw):
{ "sql": "SELECT passenger_count, AVG(total_amount) FROM taxi_trips GROUP BY passenger_count ORDER BY passenger_count" }
The endpoint returns a JSON array of row objects (the default
application/jsonresponse format), which Infinity parses directly into table rows for visualization. -
The legacy spiceai-spicexyz-datasource Grafana plugin is no longer maintained and targets the earlier Spice.ai product, not the current runtime. Use the Infinity data source against the HTTP SQL API as shown above.
